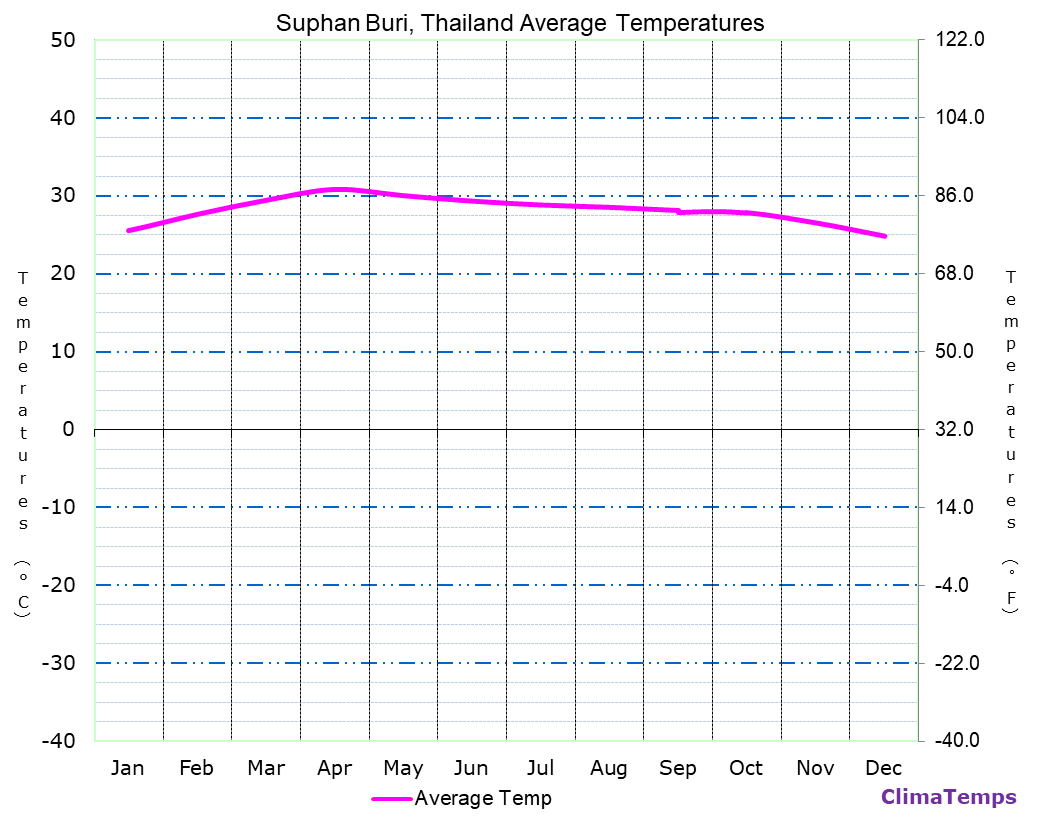
The average temperature charts use a fixed scale so that you can easily compare temperatures between two or more locations. Simply line up the charts in separate tabs in your browser and toggle between tabs to visualise the differences. The charts have major grid lines at intervals of 10 °C on the left axis corresponding with intervals of 18 °F on the right axis. Minor gridlines mark intervals of 2.5 °C and 4.5 °F. The charts show the relationship between the Celsius and Fahrenheit measuring scales. Locations in the northern hemisphere run from January to December and in the southern hemisphere from July to June so that the middle of the chart always corresponds with the high sun period (for the hemisphere).
Your Share Will Make An Essential Difference!
Please take a moment to share a climate graph or simply the address:
Thank You, so much! ❤️